Cam here! I’m back from the heat adaption camp in Samoa with Rob from Foottraffic.
The camp was amazing and it inspired last weeks blog about Group Dynamics and the power of coaching groups. Since writing that Rob and I spent 3 days at Salani Surf Resort, again mixing with a great group. I dropped into the biggest and gnarliest waves I’ve ever surfed and thrived on the support of the other surfers in our group. If I was alone, I would never of even paddled out.
I uploaded a bunch of photos to our WhatsApp group and jokingly put “Photos from Work Trip.”
Coaching opens up so much opportunity for lifestyle, enjoyment, and fulfillment. I’d love to hear a bit more about your “Coaching Lifestyle”
Anyway back to the point at hand. Some brand new features.
We are excited to bring our coaches some new features designed to streamline the coaching process and provide deeper insights into client training. Here's what new.
Adherence Dashboard
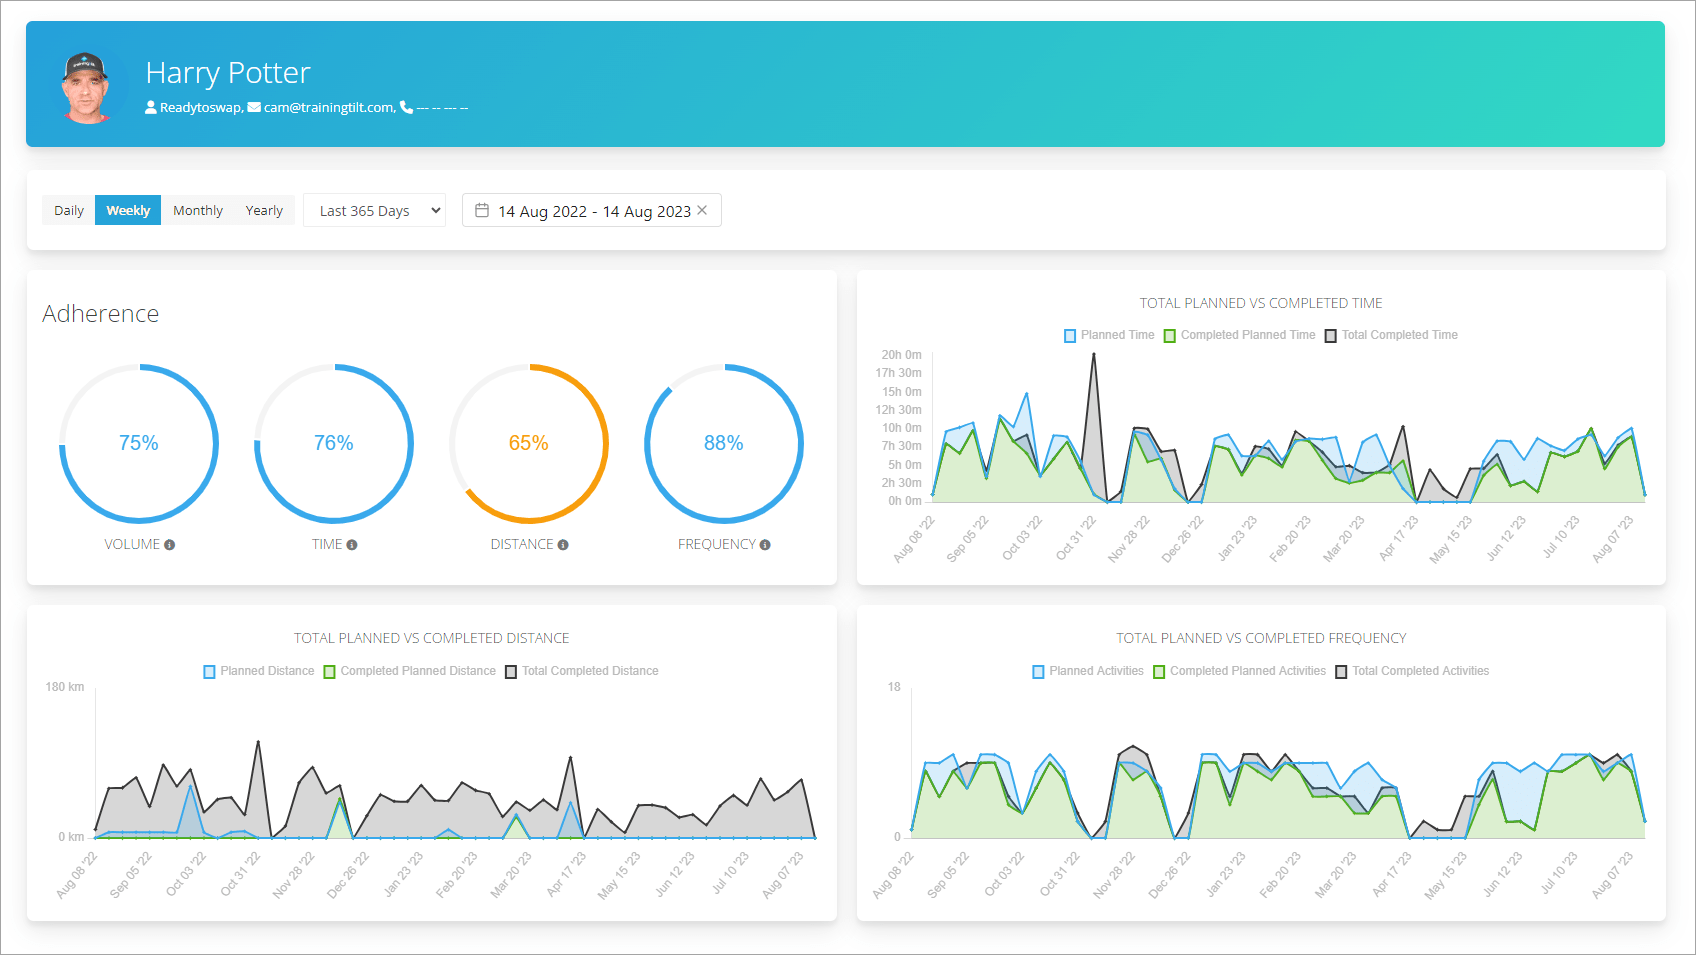
We have a brand new dashboard for view planned vs completed client training data. We’ll be adding more charts here soon too.
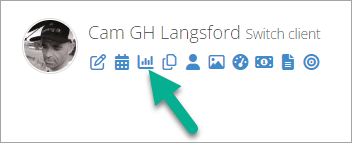
The dashboard can be found here from any client selector.
Doughnut Charts
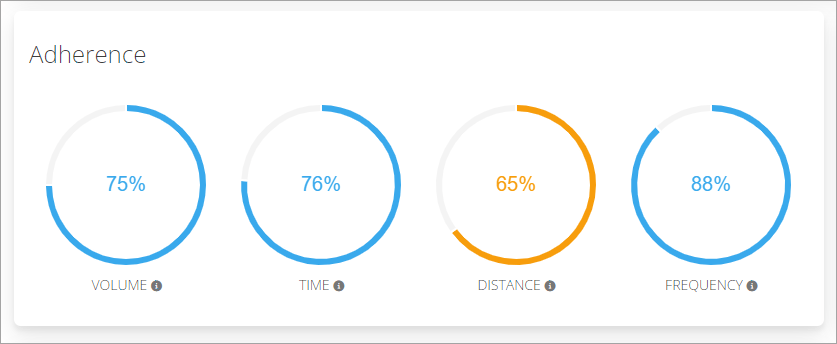
These charts show a visual representation of the percentage of prescribed training the client has actually completed. Apart from the frequency chart these only show planned vs. “completed of planned” data and do not include unplanned training. For example, if 5 hours were completed in workouts that were not planned, the 5 hours would not be included in this visual representation. Unplanned training data however is plotted on the line charts.
Time
Compares planned vs. completed time.
Distance
Compares planned vs. completed distance.
Combined Time and Distance
Merges time and distance data.
Frequency
Displays the number of sessions prescribed vs. the number completed.
Line Charts
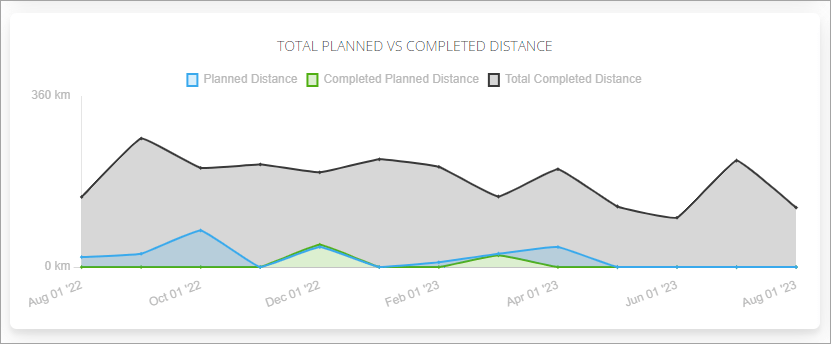
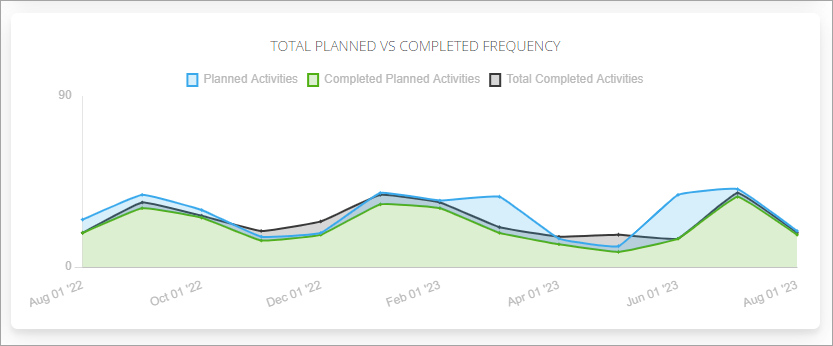
The line charts in our new adherence dashboard feature three distinct lines that allow you to visualize various aspects of your clients' training:
- Planned (Blue): This line represents the planned training metrics.
- Completed of Planned (Green): This line shows what part of the planned training was actually completed.
- Total Completed (Black): This line displays the total completed volume, including any training that was completed but not initially planned. If there was no planned volume, then only the black line will display.
These color-coded lines enable you to quickly grasp the relationship between planned and actual training, making your analysis more intuitive and efficient.
Time Chart
Observe how the planned time aligns with actual training time.
Distance Chart
Visualize planned vs. completed distance vs. total completed distance.
Frequency Chart
Track planned vs. completed frequency vs. total completed frequency.
Date Range and Aggregation Options
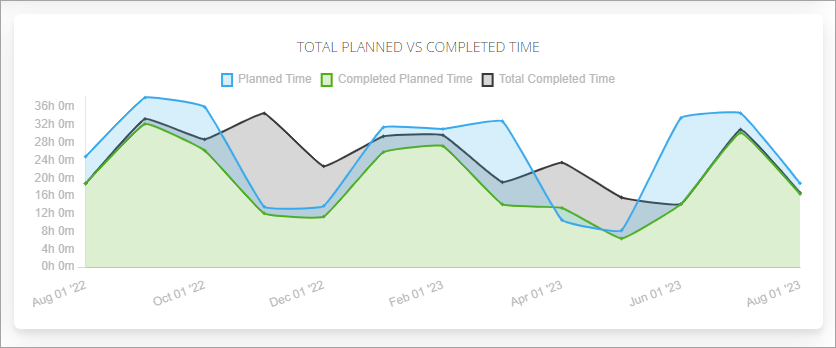
Tailor the data view to your needs with preset date ranges like "Last 30 days", “Last Month”, “This Year” or specify a custom date range. You can also aggregate data by Daily, Weekly, Monthly, or Yearly intervals to show a more or less granular chart.
Monthly vs Weekly Aggregation of the same date range shown below
Icon Upgrades
We've upgraded our icons, now using Font Awesome version 6 Explore these visually appealing icons for coaches when creating custom menu items. These icons are used across the platform but you can also use them when adding custom pages and menu items.
Hide Future Planned Sessions From a Specific Date
You now have the ability to hide future planned sessions from your clients up to a set date per client. This feature allows you to work on training plans without risking your clients seeing them until they are ready. Simply set the date you want to hide the calendar from. e.g. if you want to hide everything after and including the 25th of August, set the date to the 25th. Once you are ready for your client to see the training come back and clear the date or set it to a new date in the future.
You can set this date by editing a client’s account. This setting sits alongside the existing settings for hiding future planned sessions from a client.
Conclusion
These new features continue our commitment to providing you with the tools you need to best support your clients. Our goal with each new enhancement is to make your coaching experience more efficient, insightful, and enjoyable.
As always, we're here to support you. Should you have any questions or need further assistance, please don't hesitate to reach out.
If you want to see what else we have planned, or contribute to our roadmap you can do so here. You don’t need to be an existing Training Tilt coach to view or contribute.
Note: it’s a separate system to your Training Tilt account so you’ll need to register separately to your coach account.
Happy Coaching!
Take our Free "Authentic" Marketing Course for Coaches
Designed for endurance sport coaches. Marketing doesn't need to be pushy. The best marketing simply creates a win-win relationship between you and your customers. Take the simple 6 part course to learn more.


